
Sign Up For Newsletters
Latest Posts

Whether you’ve decided to retire or simply want to try something new, it’s finally time to se...

Jump to: Waymo founders Is Waymo going public? What is Waymo? Waymo news Pros and cons of a Waymo investm...
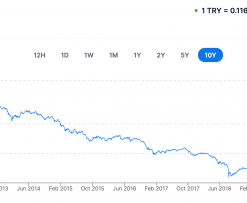
The Turkish Lira has been on a downward slope since around 2008/2009 and people often don’t underst...